Engagement Models


 Español
Data visualization solutions
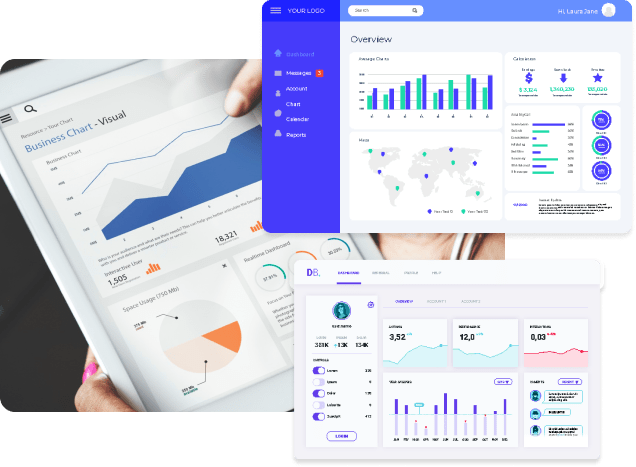
Unlock the full potential of your data with clarity and precision. Access detailed analyses through interactive dashboards and optimized visuals, designed to provide real-time insights into your business and empower strategic decision-making.
Simplify and streamline your data
Imagine trying to spot sales trends by analyzing endless rows of numbers. Now, picture those same numbers transformed into clear, intuitive charts. With our data visualization solutions, you won’t just understand your data better—you’ll make faster, smarter business decisions driven by actionable insights.
Our technology stack for data visualization

PowerBI
Leading business intelligence platform to create and visualize data with interactive dashboards, securely and in the cloud.

Tableau
AI-powered analytics platform that enables the creation of interactive reports and dashboards with an intuitive interface and multiple integrations.

BigQuery
Serverless solution to securely store data and launch your data warehouse in seconds.

Looker
Simplifies the creation of clear dashboards and reports, providing reliable insights for accurate decision-making.
Optimize efficiency across all areas of your organization
Customer service
Analyze customer feedback and support metrics to refine their experience and enhance service quality.
Sales and marketing
Monitor campaign performance, study customer behavior, and identify key sales trends to boost results.
Operations
Controla la eficiencia productiva, identifica cuellos de botella en la cadena de suministro y maximiza la distribución de recursos.
Finance
Examina el desempeño financiero, detecta riesgos potenciales y realiza proyecciones estratégicas para decisiones más informadas.
Turn your data into a competitive advantage
Gain immediate, accurate insights
Transform complex spreadsheets into easy-to-read visualizations. Spot critical patterns at a glance and make intelligent decisions faster.
Discover hidden trends
Identify trends, correlations, and outliers that might go unnoticed with traditional analysis, opening the door to strategic opportunities.
Generate actionable insights
Turn your data into compelling stories that explain the “why” behind the numbers. Foster organizational buy-in and drive decisions based on data-driven insights.
Foster collaboration across departments
Provide a common language for interpreting data. Enhance interdepartmental communication and align efforts with your business objectives.